 SELF SERVICE
NBA DATABASE & ANALYTICS
All season's NBA stats
Explore the data, create and customize your own tables, charts, build your own dashboard, share or publish them in various ways!
Full history since 1946 - 47
Each and every game, boxscore stat, player info from the very first NBA season up until today. Connect to us with your favorite analytic tool or Excel and use the data as your own. Alternatively subscribe to our data feeds and get data files via email, FTP or API connection.
Features
NO CODE Solution
You can create complex data analysis with drag and drop features, without coding or technical skills.
Data as a Service
No need to download, import or transform data. All the data arrives automatically in the background into your tool of choise.
Self-Service Analytics
Give up searching for statistics that might satisfy your needs might not. Let your thoughts flow and get your answers with some mouse clicks.
50+ Visualizations
Each of your analysis needs a visualization of its own. Choose among the endless number of charts and visuals.
Super Fast
Each of your mouse clicks are served within (sub)seconds. Our in-memory database saves a lot of time compared to regular stat websites.
Save and Share
Save your analysis in your workspace and share your findings over the internet. Generate and copy-paste the link. So easy...
Full History
All seasons, all games, all players, all actions from 1947-48 season up until today.
Dinamic Content
The data is refreshed every day. Create your analysis once, and let it have dinamically refreshed every day.
About Us
Dashball is a super-fast NBA database and analytic platform with rich data content and full history. It can be accessed, used and shared multiple ways. There are native built-in connectors for Microsoft Excel and Power BI which is maybe the most popular data analytic / visualisation tools on the market.

Ever wondered how the volume of 3-pt field goals attempts evolved throughout the years? Maybe you want to narrow the scope (filter) for only center players? Or only for players being in a certain height range? Or just by chance you want to compare left and right handed players shooting performances? Checking correlation between BMI index and any kind of performance metric? Maybe to draw a trendline over the years? Or want to know if triple-doubles really convert to wins?
You can find answers for questions like these with Dashball. Do you want to know how? Read further...
Why we are different...
Let's have an analogy for a better explanation. There are a lot of great restaurants out there. But in case you have a special need and you know the recipe, then you might consider to do it yourself. Unfortunately in a data analytic scenario it is not so easy to get the necessary ingredients. You would probably had to iterate over a dozens of sites, do exports, imports, merges, build custom functions etc. Finally you would end up with a static dataset that you can neither refresh, nor use it for any other purposes. But Dashball is just solving that for you. We do all the necessary heavy-lifting and provide you with kitchen-ready data, so that you can only care about the cooking part. We automatically collect, integrate, test, transform and pre-process all kinds of data that ends up in a daily refreshed, general-format high-performance database. You can connect to Dashball's self-service data store and pick the data you want to use!
We dont want to mislead you. Other NBA stat websites offer first-class services. Just like Michelin-star restaurants. They might even have long menus (a tons of prepared stats sites) or they might take into account your own special needs too and give you rich filtering options. But they all have certain kind of limitations. BUT! They can NOT provide any customization level that could compete with you, doing your own stuff, right? They can and will not create yet another table (chart) based on each and every person's special wish.
So Dashball is different. We do not want to cook more delicious foods, we do not want to create longer menus than others. But we would like to support and encourage you to make your own data analysis without the time consuming and cumbersome process of data collection. You have to cook your own meal, but you will have endless of options and a supportive community that helps you in the process, in case you are a less experienced cook.
So! In case you have a special question, have a unique hypothesis or curiosity that you want to validate, or you only feel like exploring the data to find some pattern that was not discovered by anybody yet, you can make a difference with Dashball! Data analytics - just like cooking - is not only for professionals after all!
Demo
Power BI
Excel
Pricing Plans
|
Free
|
Basic
|
Advanced
|
Custom
|
|
| $0 / month | $5 / month | $15 / month | CONTACT US | |
| Data access | Last 3 seasons | Full | Full | |
| Available metrics | Core | Core | Core + Advanced | |
| Microsoft Excel Connectivity * | ||||
| Mobile app availability | ||||
| 60 days free Power BI licence | ||||
| Weekly 1 hour Q&A session | ||||
| 30min Personal Onboarding Support | ||||
* Only available for Windows |
||||
How To Use
Power BI (PBI) Account
In order to use the Dashball NBA self-service database, you have to own a PBI account and related licence. To streamline the registration process, we will automatically establish a PBI account along with a 60 days free trial licence to you. Please don't hesitate to contact us if your Power BI trial period deadline approaches. We're available to discuss the next steps.
* Please note, that your PBI username is not an email address!
Setting up Power BI services
In order to use any of Dashball's PBI services, you have to own a properly configured PBI account. Herewith we show you how to do it.
- Create a Dashball.app account and log in!
- Activate your PBI account (if not yet done) with a default "FREE" plan on your profile page
- Log in to the PBI site using your PBI username and password!
- Choose whether you want to stay signed in, after the browser closes. (recommended)
- That's it! Try out all our features! If you are satisfied with them, you might consider going to your profile page and upgrade your subscription plan in order to gain full data and feature access!
Power BI First Steps
The Power BI Website is the default place and central hub to create and manage all your analytic content. You can create your own charts, dashboards or any content Power BI has to offer. Besides, you can create workspaces, bookmarks, tag dashboards, share all of your content with individual users, groups, or even make it publicly available over the internet. Unfortunately we can not introduce each and every features here, but we will show you the basic steps and will propose some useful links too.
- Open and log in to the Power BI Site in your browser!
- Click on the Create New Report button! (Upper right area)
- Click on the "Pick a published semantic model" option!
- Click on the model you want to use!
- Click on the "Create blank report" button.
- A brand new canvas will be displayed with some panels on the right hand side. Within these panels you will find all the metrics and data fields, the default visualization options and the applied filters panel.
- Create your content! If you are not familiar with using Power BI, check our Demo, join our weekly Q&A sessions, or search for some great Power BI tutorials on Youtube!
- If you want to save your report for later, go the "Save" button, give it a proper name and select the Workspace you want to save your report into!
- Great! Your content is successfully saved to the Power BI Site! You can open it anytime from your web browser or from the Power BI mobile app! The content will always reflect the most actual data!
Connectivity Options
Microsoft Excel
You can directly connect your local Excel client to the Dashball database! You can create your own pivot tables, charts or even dashboards. Remember, you dont have to import any data here. The remote dashball database will be queried "on the fly" every time you make changes on your pivot tables or charts. If you are not familiar with Excel pivot functions, you can visit our Demo section or check an introductory overview about them. Be aware, that this option only works on Windows computers. However its rare, but there are might some issues with some versions of Excel, so please check that it is working properly prior to choose any of our paid solutions!
Create your first Excel Analysis by following the steps below!
- Make sure that a proper Microsoft Excel version is installed on your computer.
- Download the skeleton .xlsx file to your computer and open it!
- Depending on your Excel settings, you might have to enable editing and external data connection as shown in the pictures below.


- Sign in with your PBI username and password.
- Nice! You will have a local excel file opened and connected to the Dashball NBA database.
- You will have a blank pivot table on your screen and the field list (organised in a folder structure) on the right hand side.
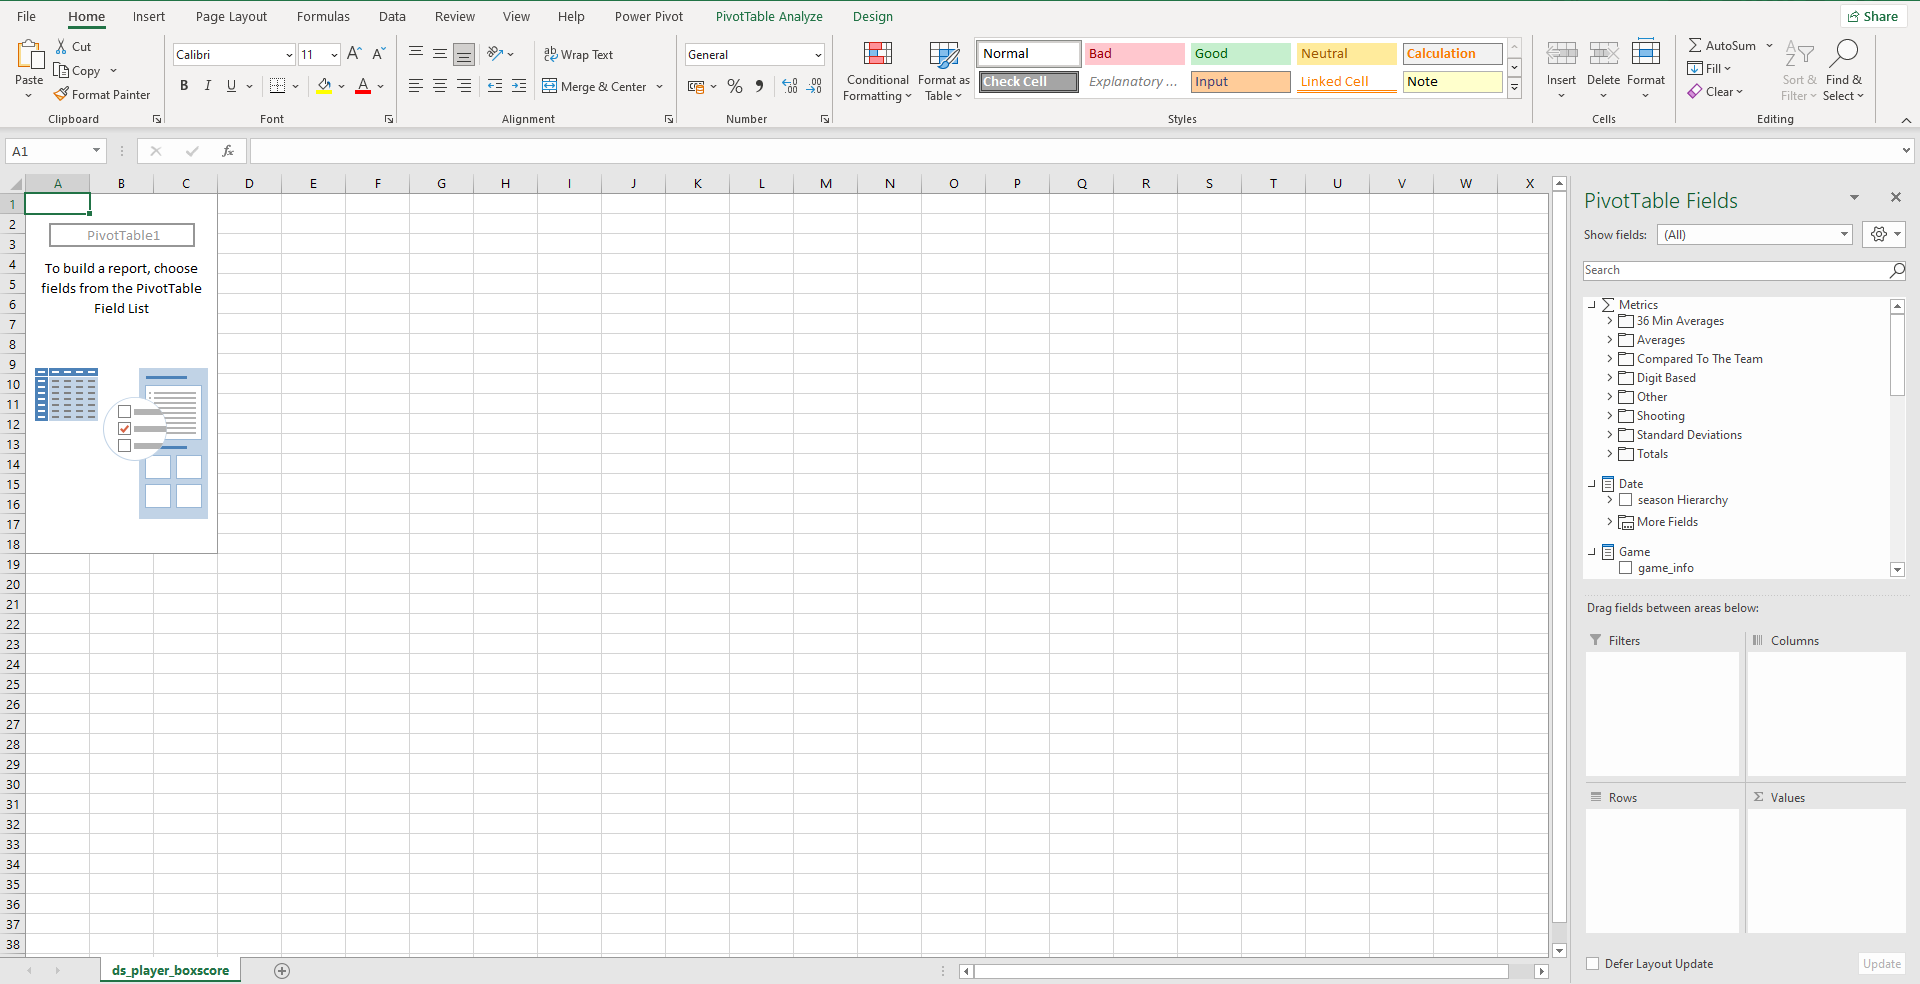
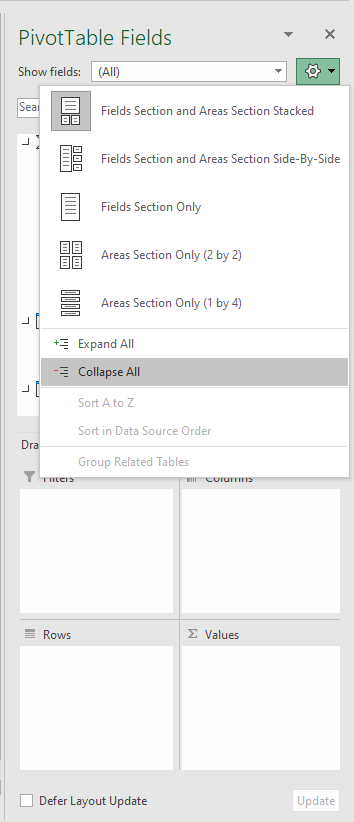
- Collapse the folders to have a better overlook about available metrics and data field.
- Dropdown Metrics folder, pick your metric(s) and drag and drop them to the box named "Values"! In our example we will choose /Metrics/Digit Based/Trp-Dbl GAMES and /Metrics/Other/WIN % as metrics.
- You will see that the pivot table immediately refreshes. Since you have not applied any filters or grouping (segmenting) yet, it will show you the total number of triple-doubles and the Win % for all the games played in the NBA (ABA).
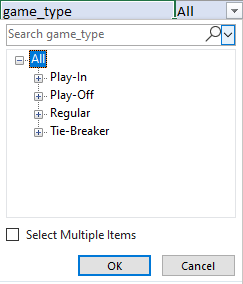
- Pick your filter(s) you want to apply and drag and drop them to the box named "Filters"! In our example we will choose Game/game_type for filtering.
- The filter panel will show up right above your pivot table. Click on the dropdown button and list the available values. Click on the "Regular" value. The filter action will take effect immidiately and show you only the figures for regular season games.
- Choose your segmentation attribute and drag and drop them to the box named "Rows". In our example we will choose /Player/Main/player_name as the segmentation value.
- After pivot table refreshes, you will see the total number of triple-double games and Win % for regular season games, broken down to players. As you have not made any sorting yet, it will be listed in alphabetical order.
- Go to the pivot table's Trp-Dbl GAMES column's first value. Most probably it will be located in the B5 cell. Right click with your mouse and pick the "Sort" > "Sort Largest to Smallest" option.
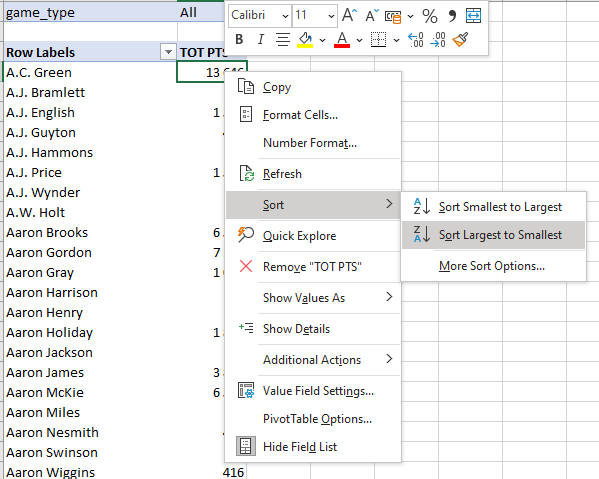
- You will see the number of regular season triple-doubles and Win %, broken down by players, sorted decreasingly by the number of triple-doubles.
- Remember, this is only one scenario out of billions of possible combinations of metrics, filters and groupings. You are free to change any of them dinamically. Optionally you can also use pivot charts, slicers and other visual elements Excel has to offer. You can check our Demo video or other examples over the internet to learn some tips and tricks.
Power BI Desktop
If you are feeling like an advanced PBI user, or want to get further customization opportunities, you might consider downloading and using the Power BI Desktop client. The dashboard design interface is similar to the web version, and you can also upload your content to the Power BI site. If building content is the only thing what you want, you might stay with the web version. However if you want to build and save your content locally, or want to create (or extend) the data model or use any other "desktop only" features, you might choose this option. Be aware again, that Power BI desktop only exists for Windows operating systems.
Create your first Power BI Dekstop content by following the steps below!
- Make sure that you have Power BI Desktop installed on your Windows machine.
- Download the skeleton .pbix file to your computer and open it!
- You will have a Power BI file opened and connected to the Dashball NBA database.
- Create your content! If you are not familiar with using Power BI, check our Demo or search for a proper Power BI tutorial on the internet!
- If you want to save it to the Power BI Cloud, go to File/Publish/Publish menu and click on the "Publish to Power BI" button. Select the workspace you want to save your content into. Click Select!
- Success! Your content is successfully saved to the Power BI site .
Power BI Mobile App
iOS, Android and Microsoft all have native Power BI applications in their app stores. Thus, you can view your previously built content on your mobile as well. However, you can NOT create any content here. That would be a bad idea anyway...
Useful Links
You can find many free or cheap tutorials about Power BI and Excel Pivot tables on the internet. Typing the right keywords to the search enginges will definitely result in many page hits. However we also provide you with some useful links to give you a better start.